How CFOs Are Measuring ROI on Agentic AI in Financial Services
CFOs need more than cost savings to measure AI ROI. Learn the four-pillar framework for calculating hard ROI, soft ROI, and strategic value from agentic AI in financial services.
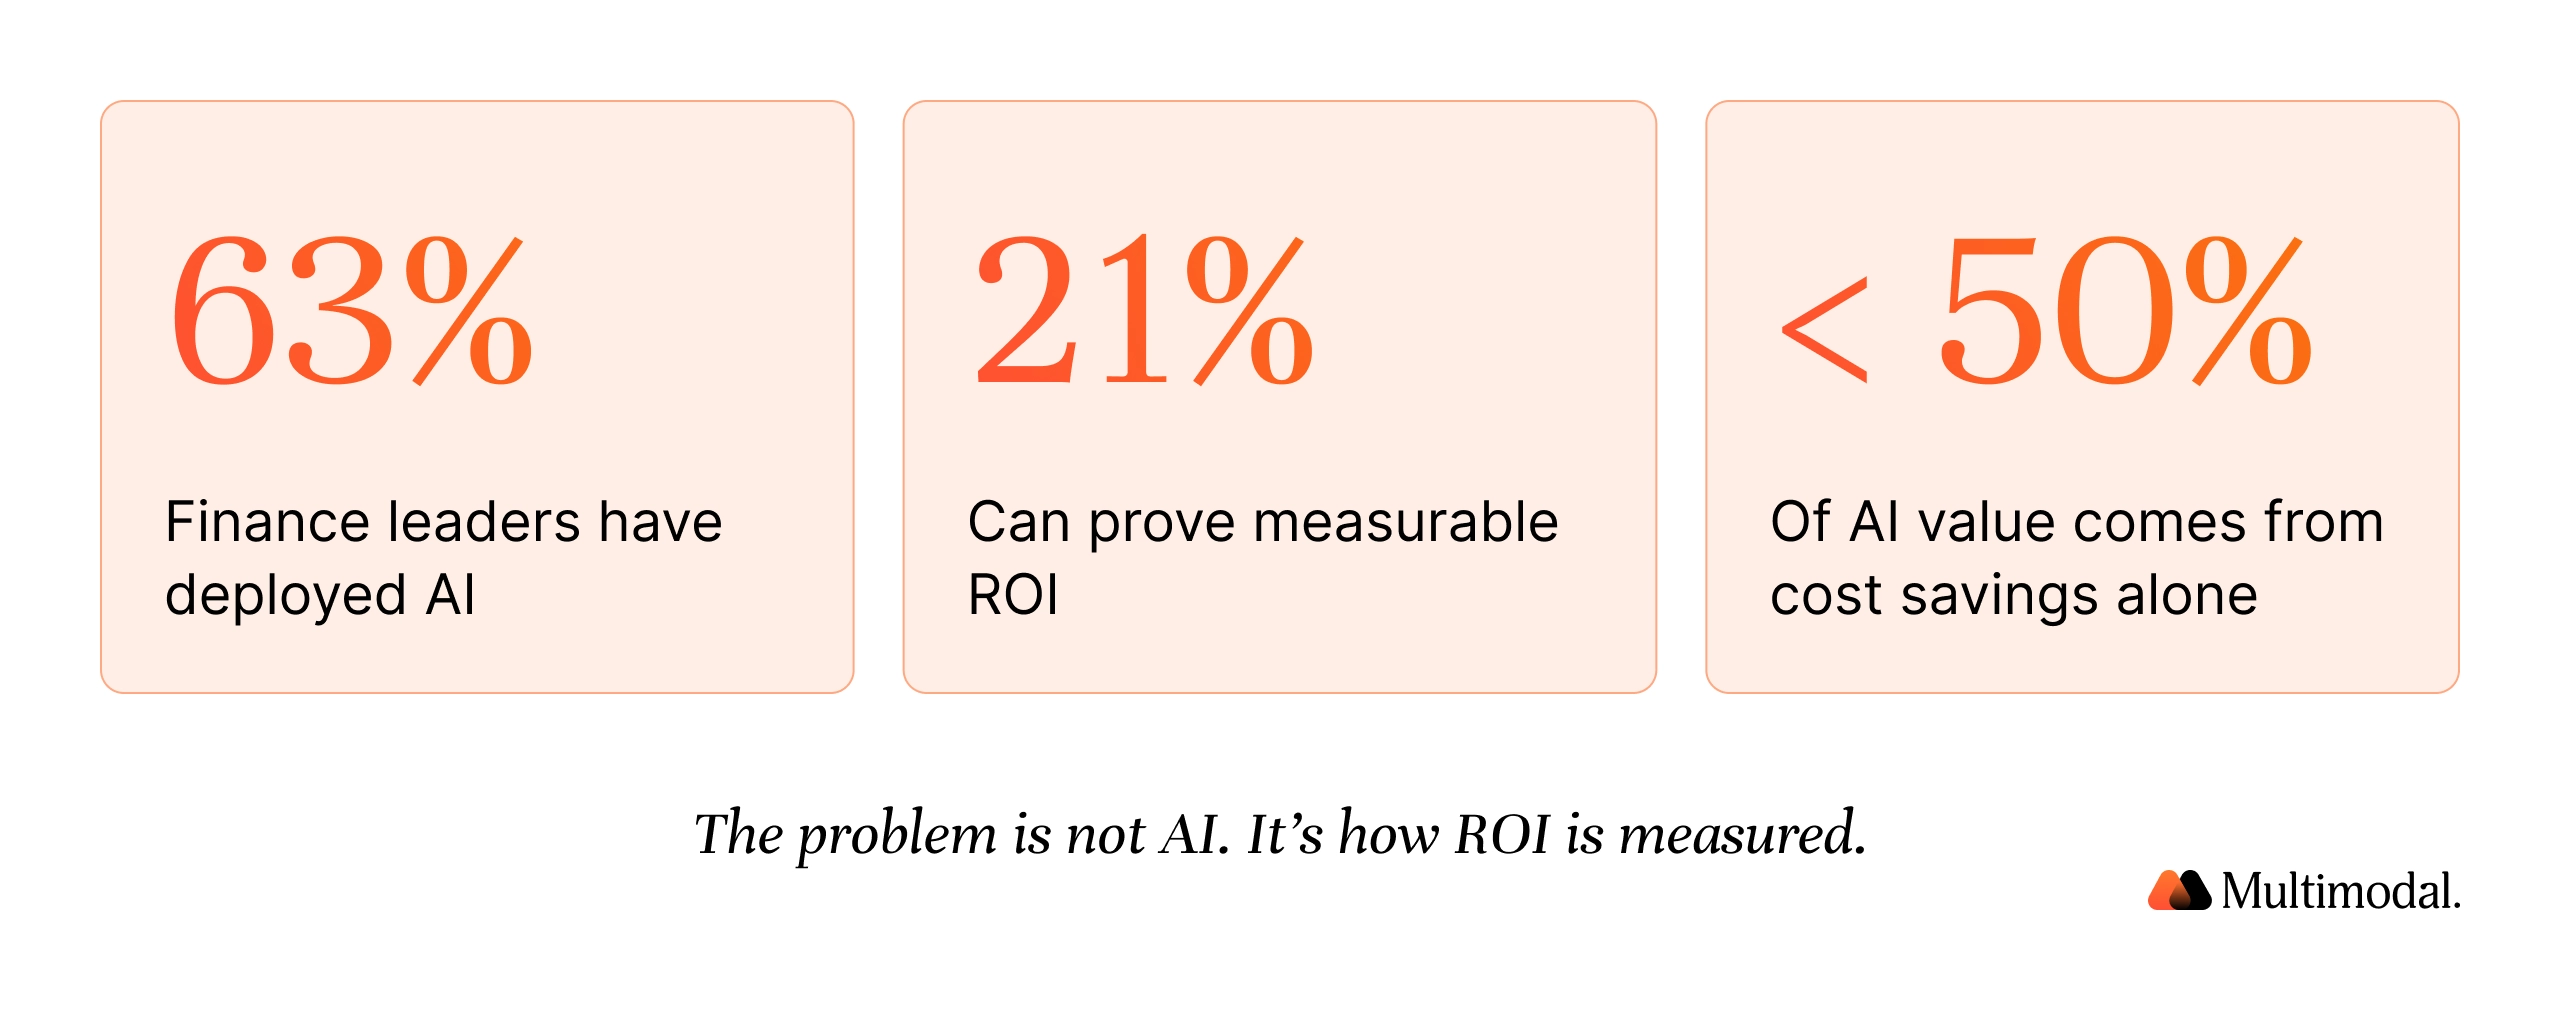
Cost savings alone capture less than half of AI's total value.
Only 21% of finance leaders can prove measurable AI ROI today.
Agentic AI delivers 80% cost reduction with sub-four-month payback periods.
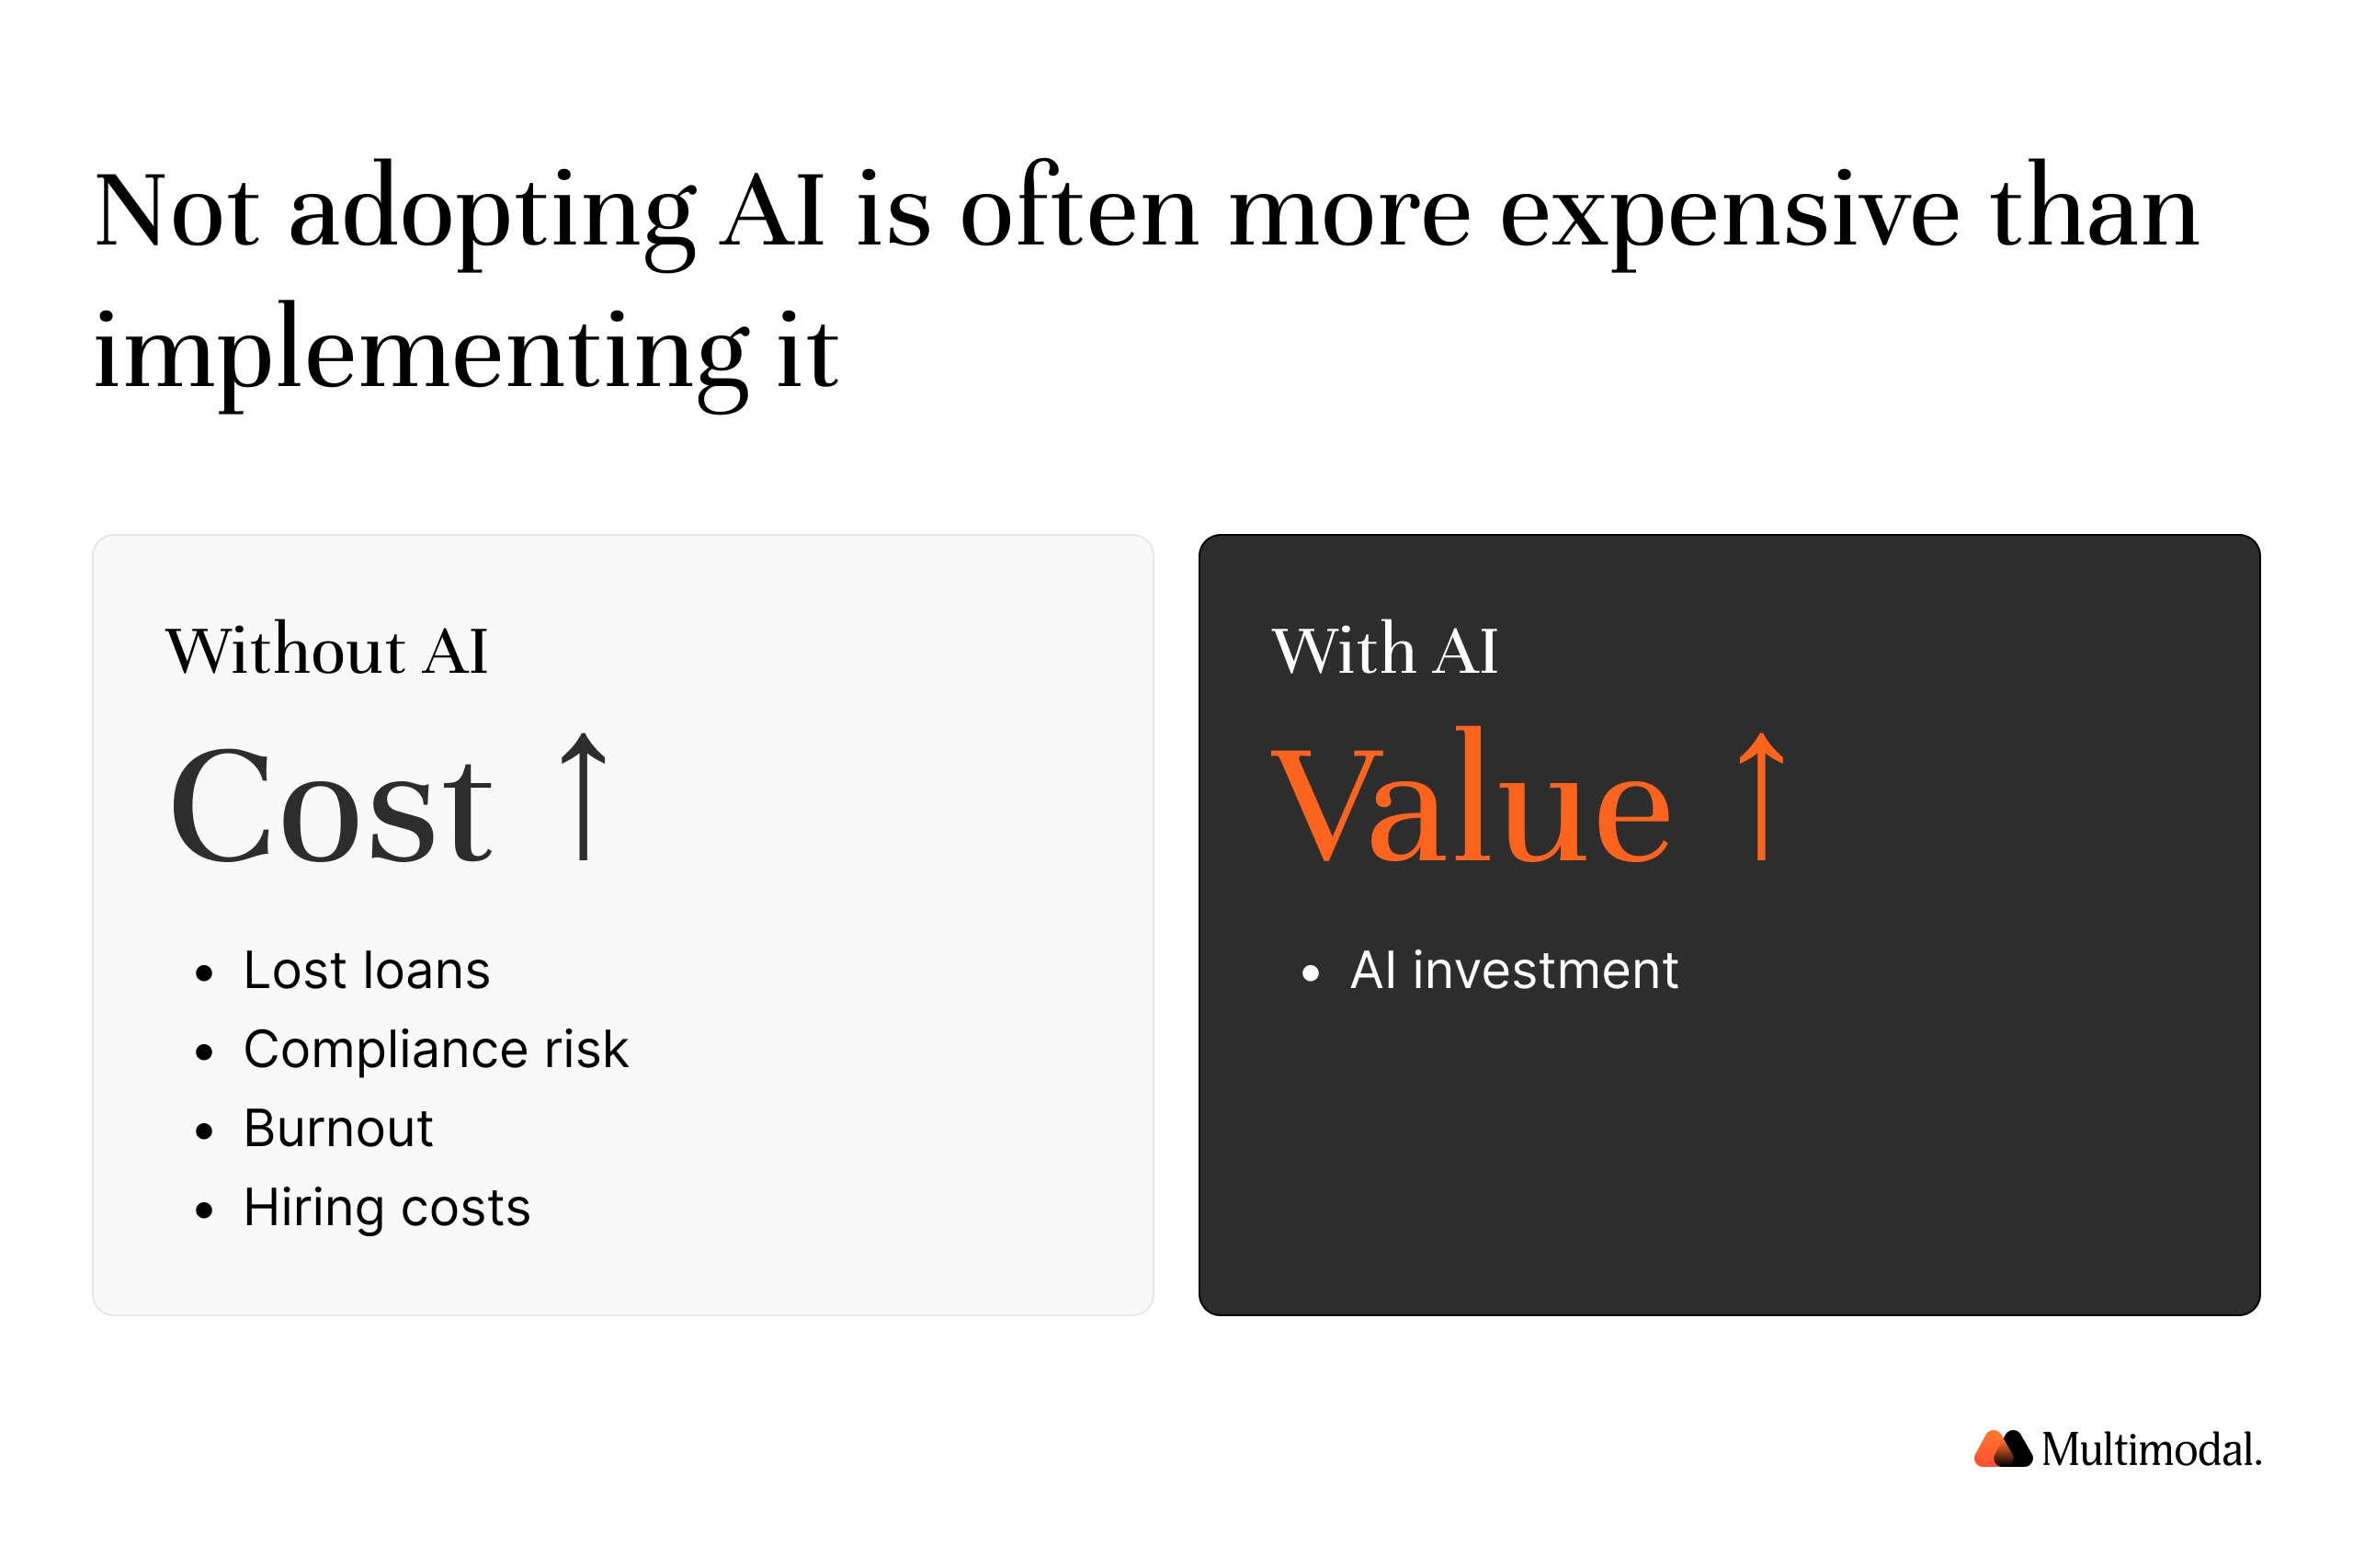
The cost of not automating often exceeds AI implementation costs.
Winning board cases lead with business problems, not AI capabilities.
Get 1% smarter about AI in financial services every week.
Receive weekly micro lessons on agentic AI, our company updates, and tips from our team right in your inbox. Unsubscribe anytime.
Thank you! Your submission has been received!
Oops! Something went wrong while submitting the form.
Most AI ROI calculations are wrong. They measure cost savings but ignore the three key metrics that actually matter to financial institutions: regulatory risk reduction, processing speed for revenue capture, and examiner readiness. As a result, business leaders presenting AI business cases are underselling the real value of their AI initiatives.
According to Deloitte's Finance Trends 2026 survey, 63% of finance leaders have fully deployed AI solutions, yet only 21% report clear, measurable ROI. The problem is not the artificial intelligence. Traditional ROI models were built for software licenses and headcount swaps, not for the compounding value that agentic AI systems produce.
This post presents a comprehensive framework for measuring roi in financial services, walks through real roi calculations, and addresses the hidden costs most business cases ignore.
Beyond Cost Savings: The Real AI ROI Framework for Financial Services
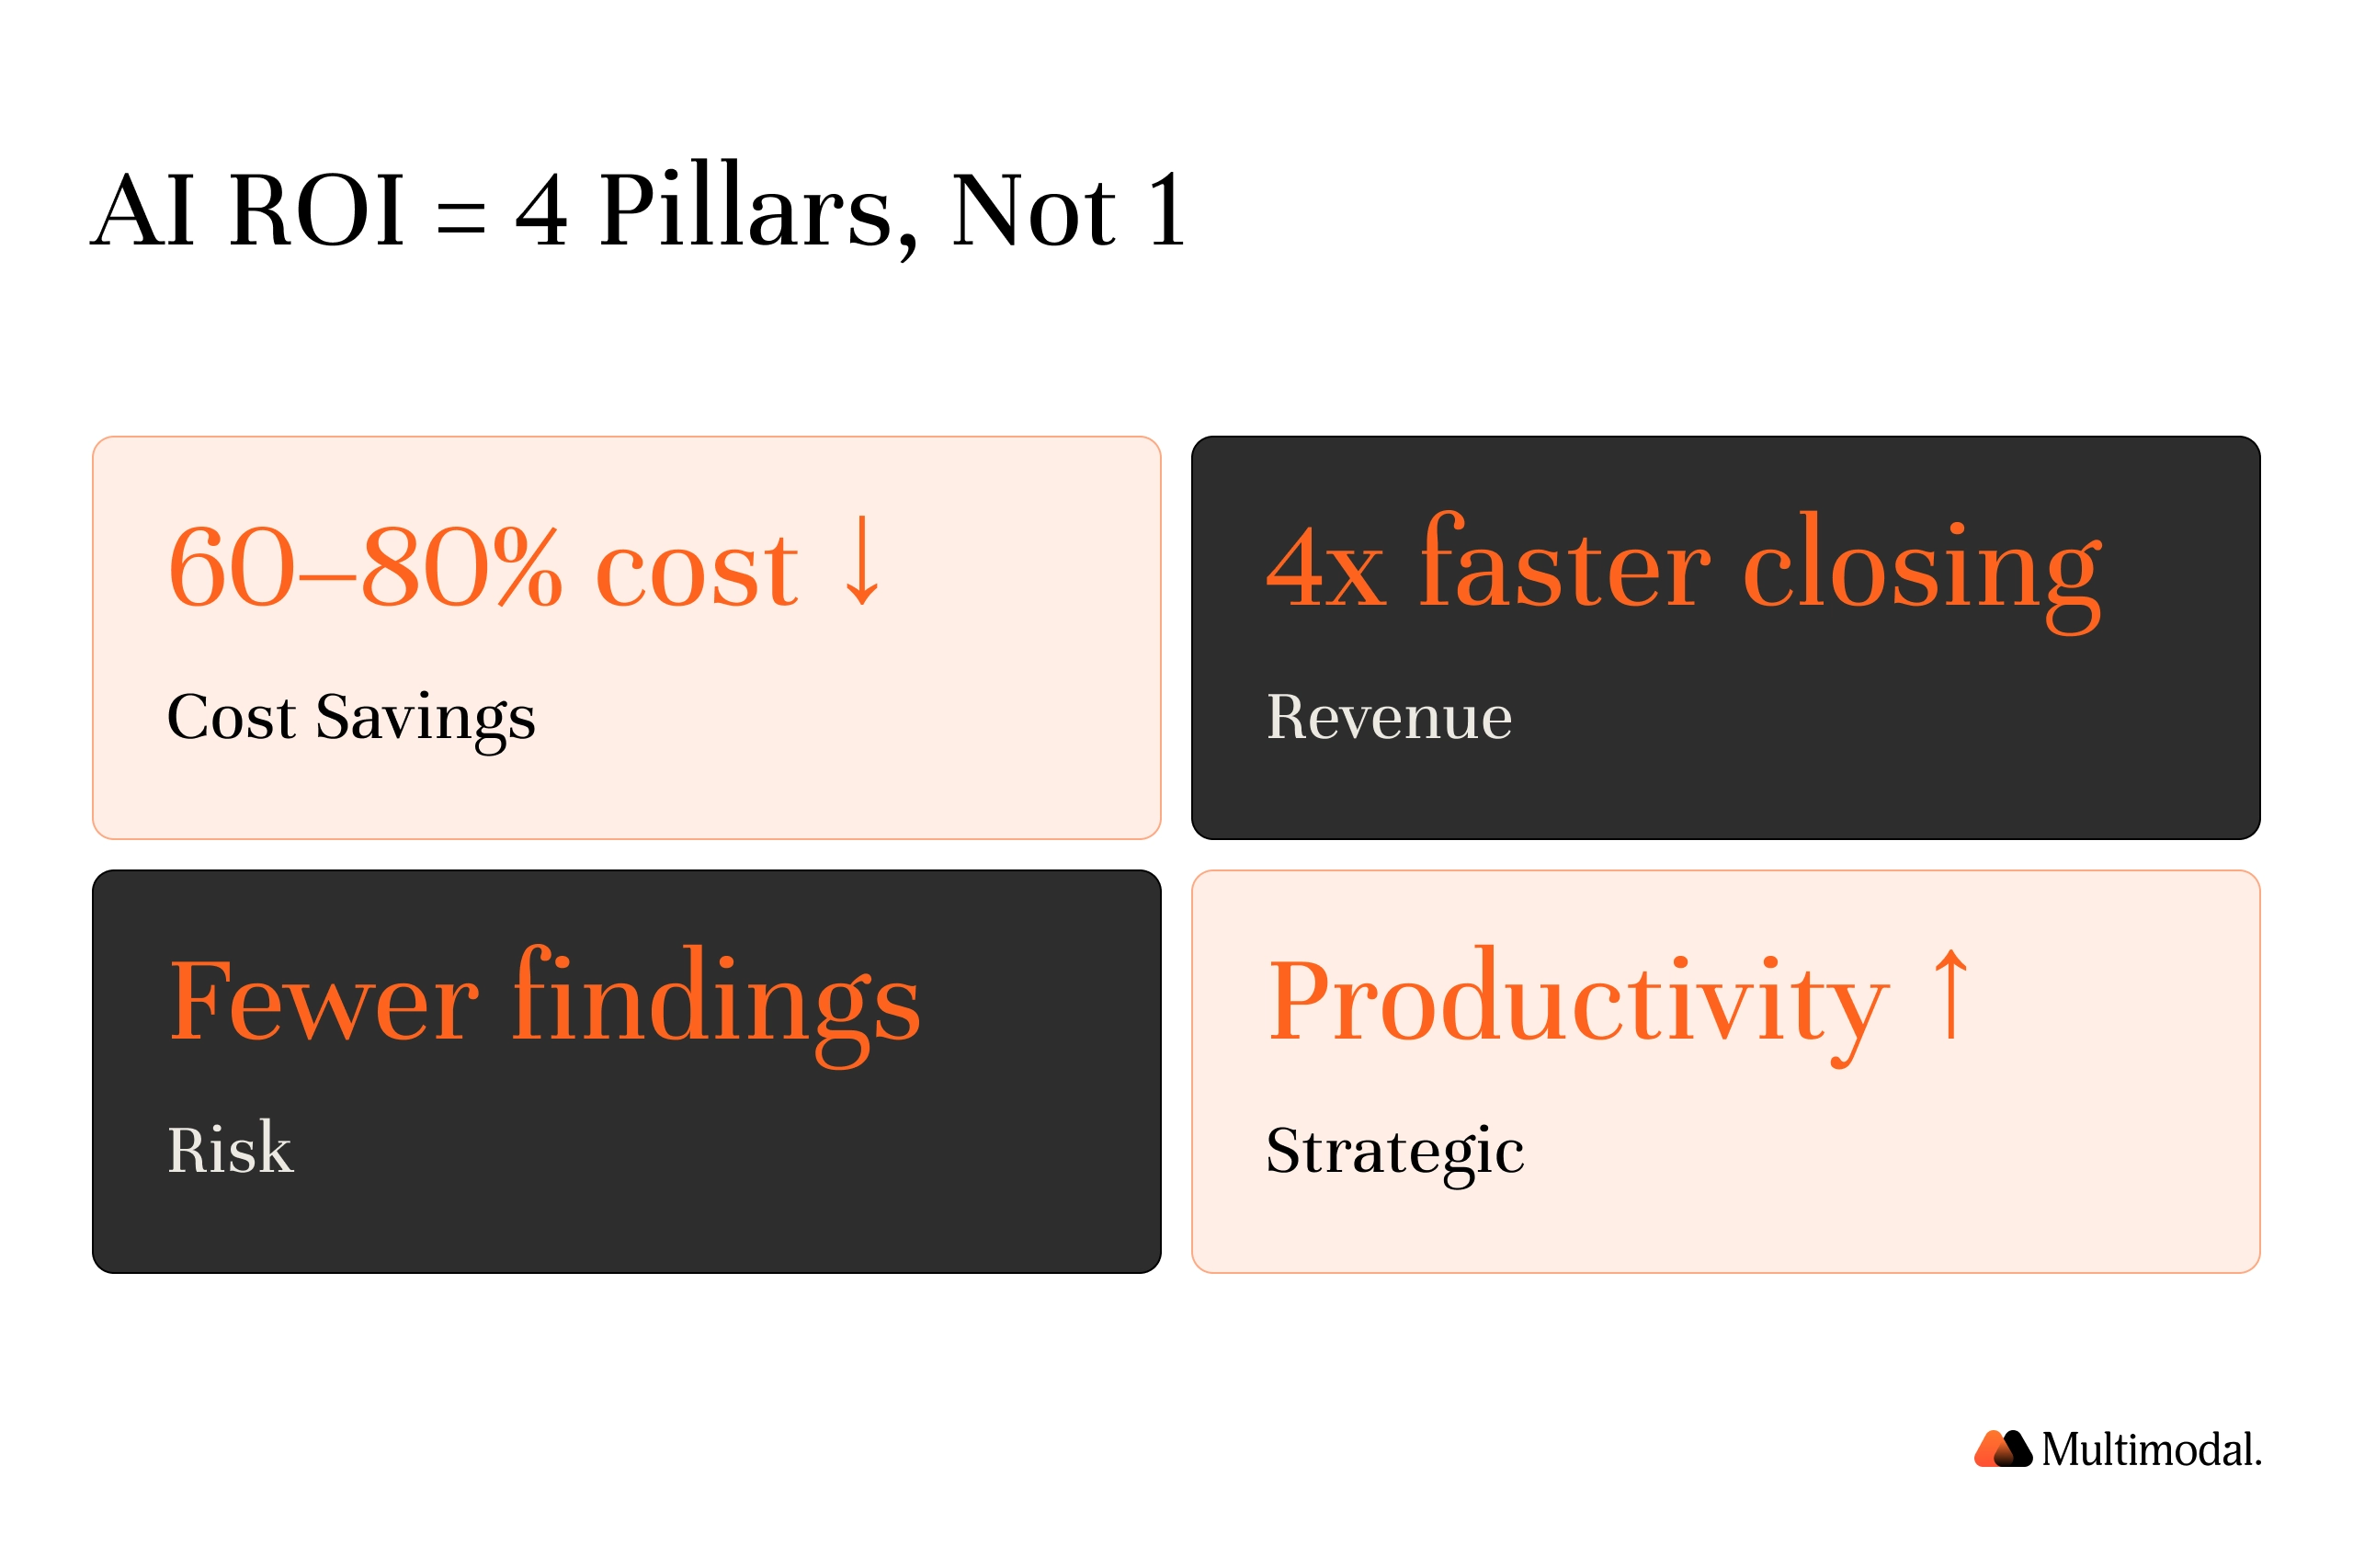
When business leaders default to FTE reduction as the primary AI metric, they capture direct cost savings but miss the majority of the value. In financial services, where compliance penalties, processing speed, and customer satisfaction drive business performance, the ROI of AI spans four pillars.
Without this broader view, organizations risk jumping on the AI bandwagon without a framework to validate their business objectives.
Pillar 1: Direct Cost Savings (Hard ROI)
Hard ROI includes FTE reduction, error correction costs, and reduced overtime. For AI projects in document processing and compliance reporting, these gains typically appear within 90 days of AI implementation. Machine learning models and AI tools handle extraction and classification at scale, replacing manual effort with auditable output.
But stopping at hard roi understates total value. Deloitte's 2025 survey found that 85% of organizations increased AI investments, yet most reported satisfactory ROI only within two to four years. The gap reflects a measurement failure: organizations tracking only hard roi miss the compounding returns in pillars 2 through 4.
Pillar 2: Revenue Acceleration
Every day a loan application sits unprocessed is a day it might go to a competitor. Revenue growth from AI is driven by faster processing cycles that let institutions close more loans and capture opportunities before they expire. A credit union reducing cycle time from 5 days to 1.2 days captures loans that would have been lost, creating new revenue streams from the same volume.
McKinsey estimates generative AI could deliver $200 to $340 billion in additional annual value across banking. This is where AI-driven marketing and lead generation intersect with operational speed to produce business value that traditional ROI models miss.
Pillar 3: Risk Reduction
AI governance and AI-powered compliance monitoring reduce regulatory exposure. Risk management value shows up as fewer examiner findings, lower remediation costs, and faster response to regulatory changes.
Cornerstone Advisors found that roughly 40% of banks and 50% of credit unions saw fraud losses increase in 2025, with three-quarters planning to increase fraud prevention budgets. AI-powered fraud detection represents value that rarely appears in roi calculations but directly protects the bottom line.
Pillar 4: Strategic Value (Soft ROI)
Soft ROI captures non-financial benefits that drive competitive advantage: improved customer satisfaction scores, reduced turnover from eliminating repetitive tasks, better data quality for data-driven decision making, and the ability to scale without proportional headcount. Deloitte's State of AI in the Enterprise 2026 report found that 66% of organizations report productivity gains from AI adoption.
Among financial services AI leaders, 47% say ROI from advanced gen AI initiatives exceeds expectations. These pioneers measure ROI across all four pillars, capturing both hard and soft ROI, rather than restricting their view to cost savings.
The Numbers: What Financial Institutions Are Actually Seeing
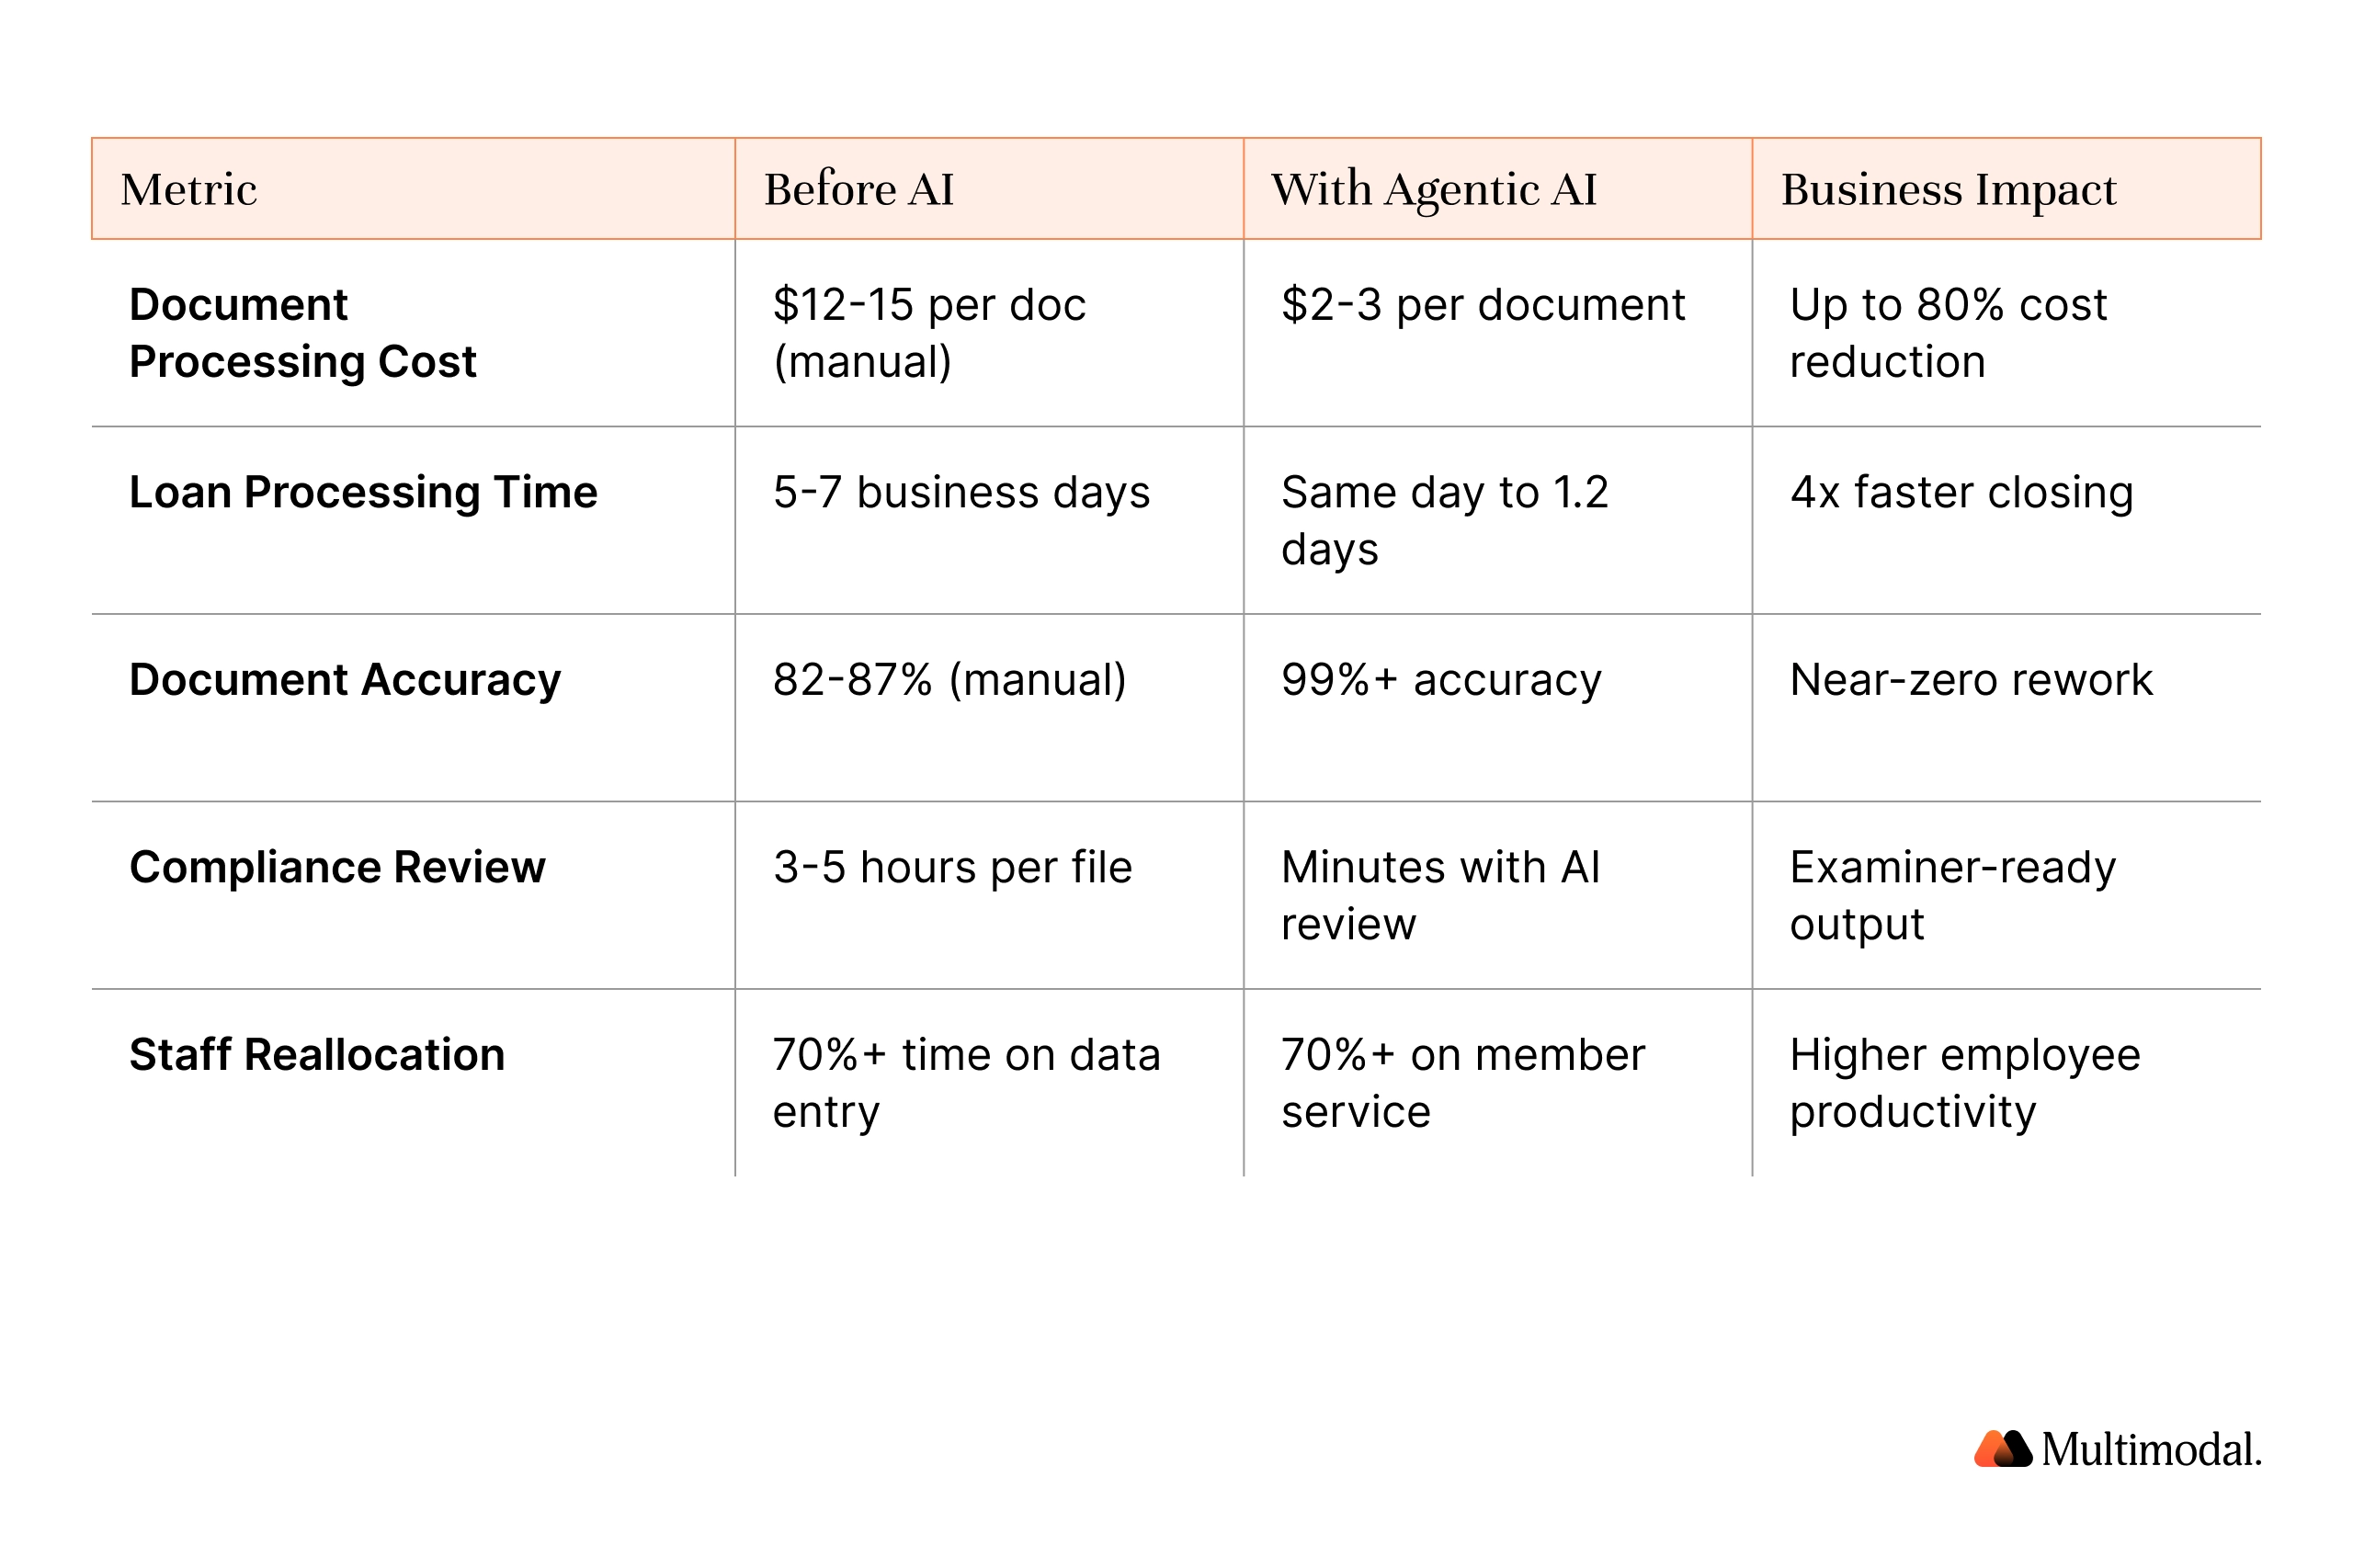
CFOs need hard numbers. Below are benchmarked results from agentic AI deployment, showing what AI agents and AI-powered tools deliver in production with minimal human oversight on routine tasks.
BCG found that institutions adopting AI with specialist teams achieve up to 60% efficiency gains and 40% cost reductions in onboarding, compliance, and settlement. The institutions seeing the most value are embedding AI across full business processes, from document intake through compliance reporting, using agentic AI systems that operate end-to-end with minimal human input, while routing complex decisions to experienced staff. This delivers operational efficiency and productivity gains that isolated AI tools cannot match.
How to Calculate Your AI ROI: Step-by-Step
Calculating roi for AI projects requires inputs that any CFO can pull from existing operational data. This framework applies across lending, compliance, and back-office business processes.
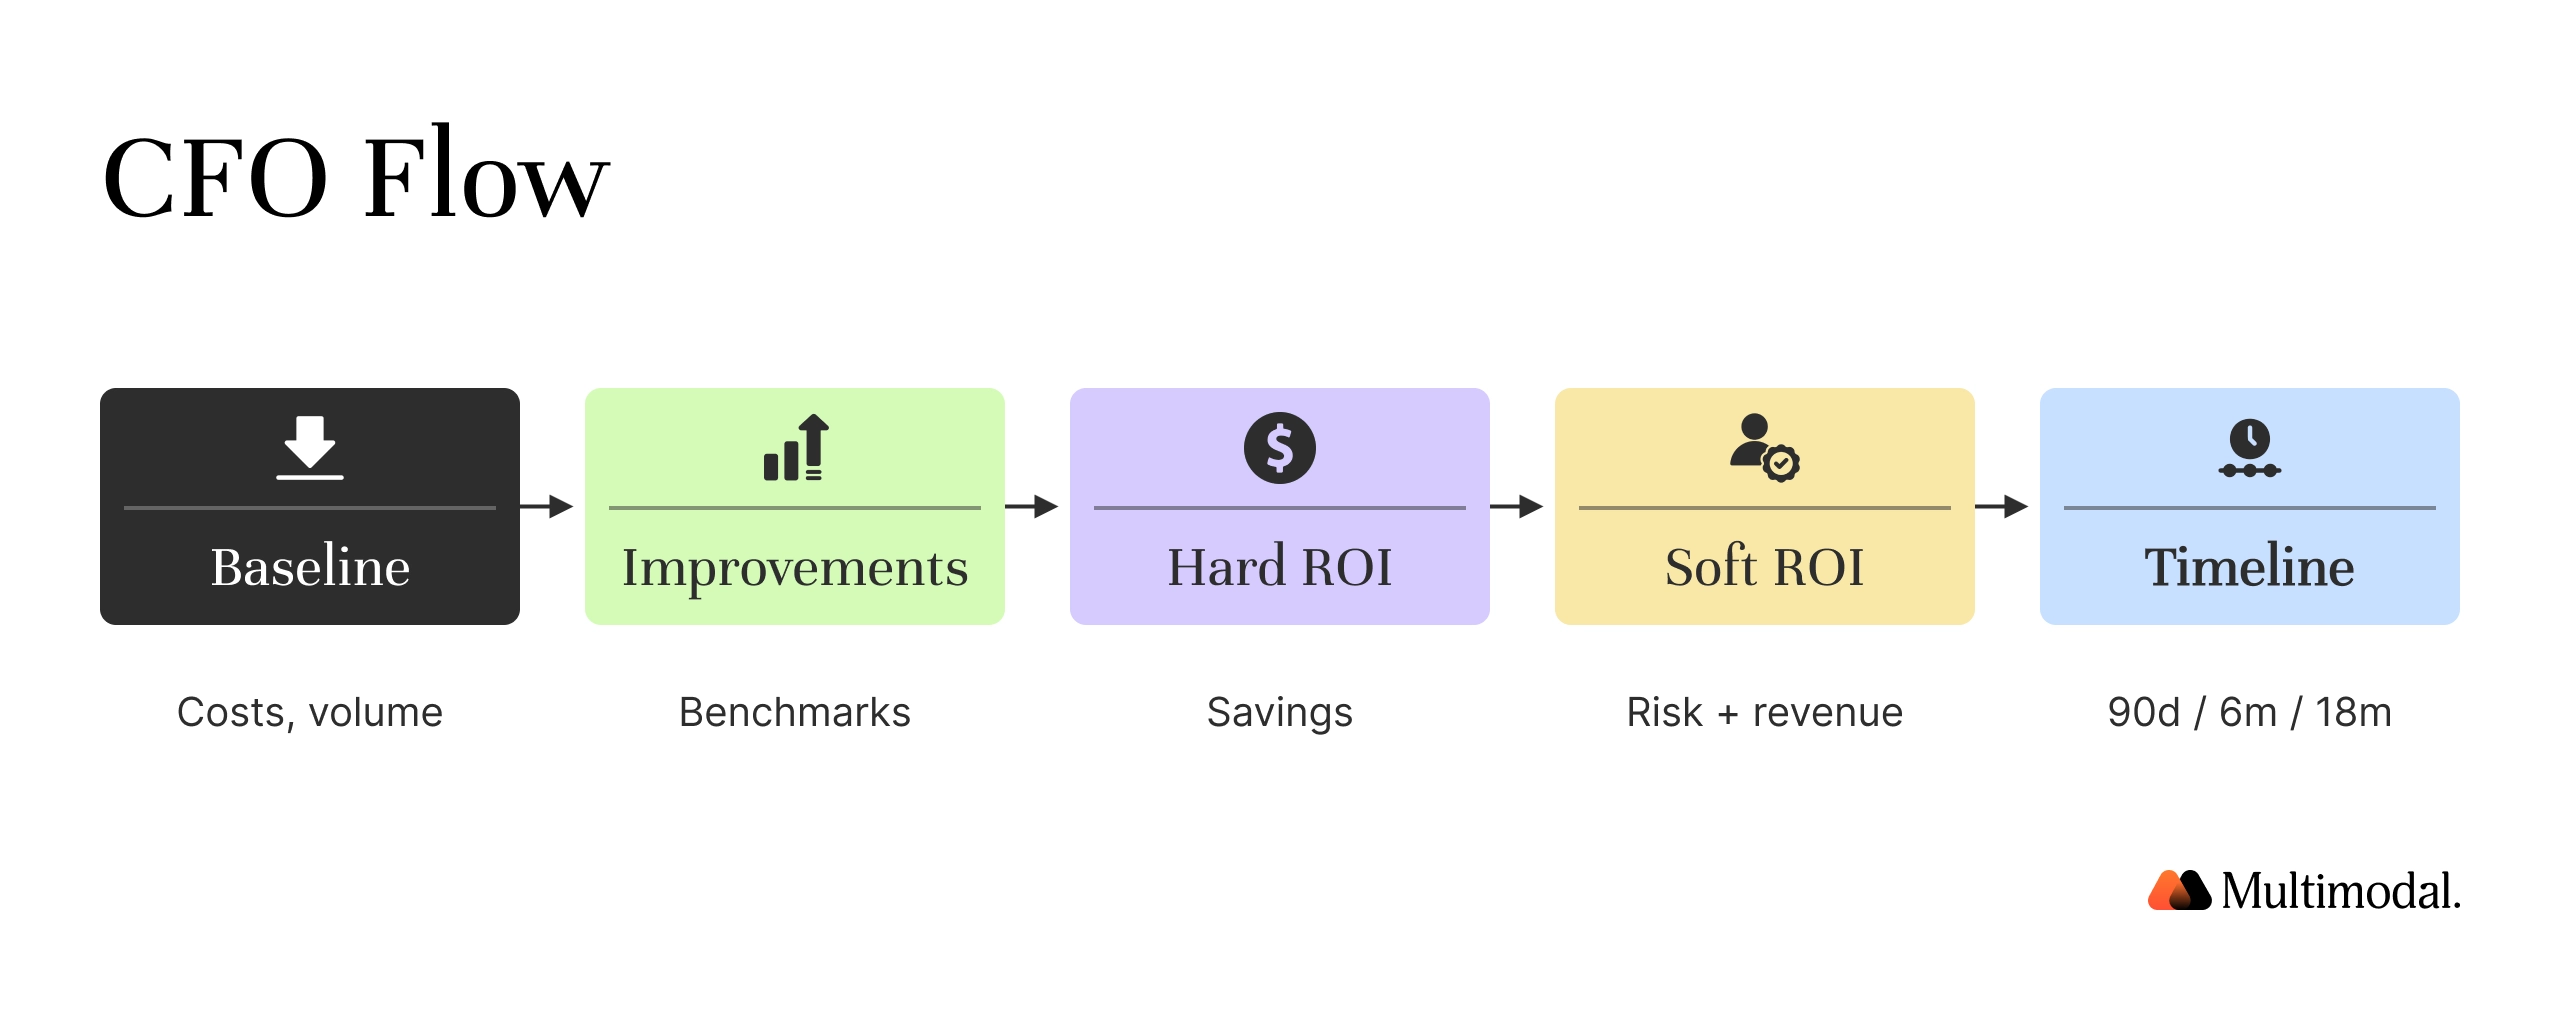
Step 1: Establish Your Current Cost Baseline.
Identify the business unit and workflow. Gather monthly processing volume, fully loaded cost per unit, processing time, error rate, and annual compliance costs. Cornerstone Advisors found community institutions score just 241 out of 500 on data quality execution, so fixing relevant data gaps is critical for AI planning.
Step 2: Project AI-Driven Improvements.
Using benchmarks, estimate: 60-80% reduction in per-unit cost, 70-85% reduction in processing time, 90%+ accuracy improvement, and 50-70% reduction in compliance review hours. These reflect what AI agents deliver in production, not theoretical maximums from AI models in controlled settings.
Step 3: Calculate Hard ROI.
Annual Hard ROI = (Current Annual Cost - Projected Annual Cost with AI) - Annual AI Platform Cost. Include all AI cost factors: licensing, integrating AI into existing systems, change management, training, and data preparation.
Step 4: Quantify Soft ROI.
Estimate the financial value of risk reduction, revenue acceleration, and employee productivity improvements that boost employee productivity and customer satisfaction gains. Even conservative soft roi estimates typically double the total business value compared to hard roi alone.
Step 5: Build the Business Case Timeline.
Present across three horizons: 90-day quick wins (hard roi), 6-12 month compounding returns (revenue and risk), and 18-24 month strategic value (competitive advantage, decision-making capabilities). This satisfies both the CFO seeking near-term payback and the board evaluating corporate strategy and AI transformation.
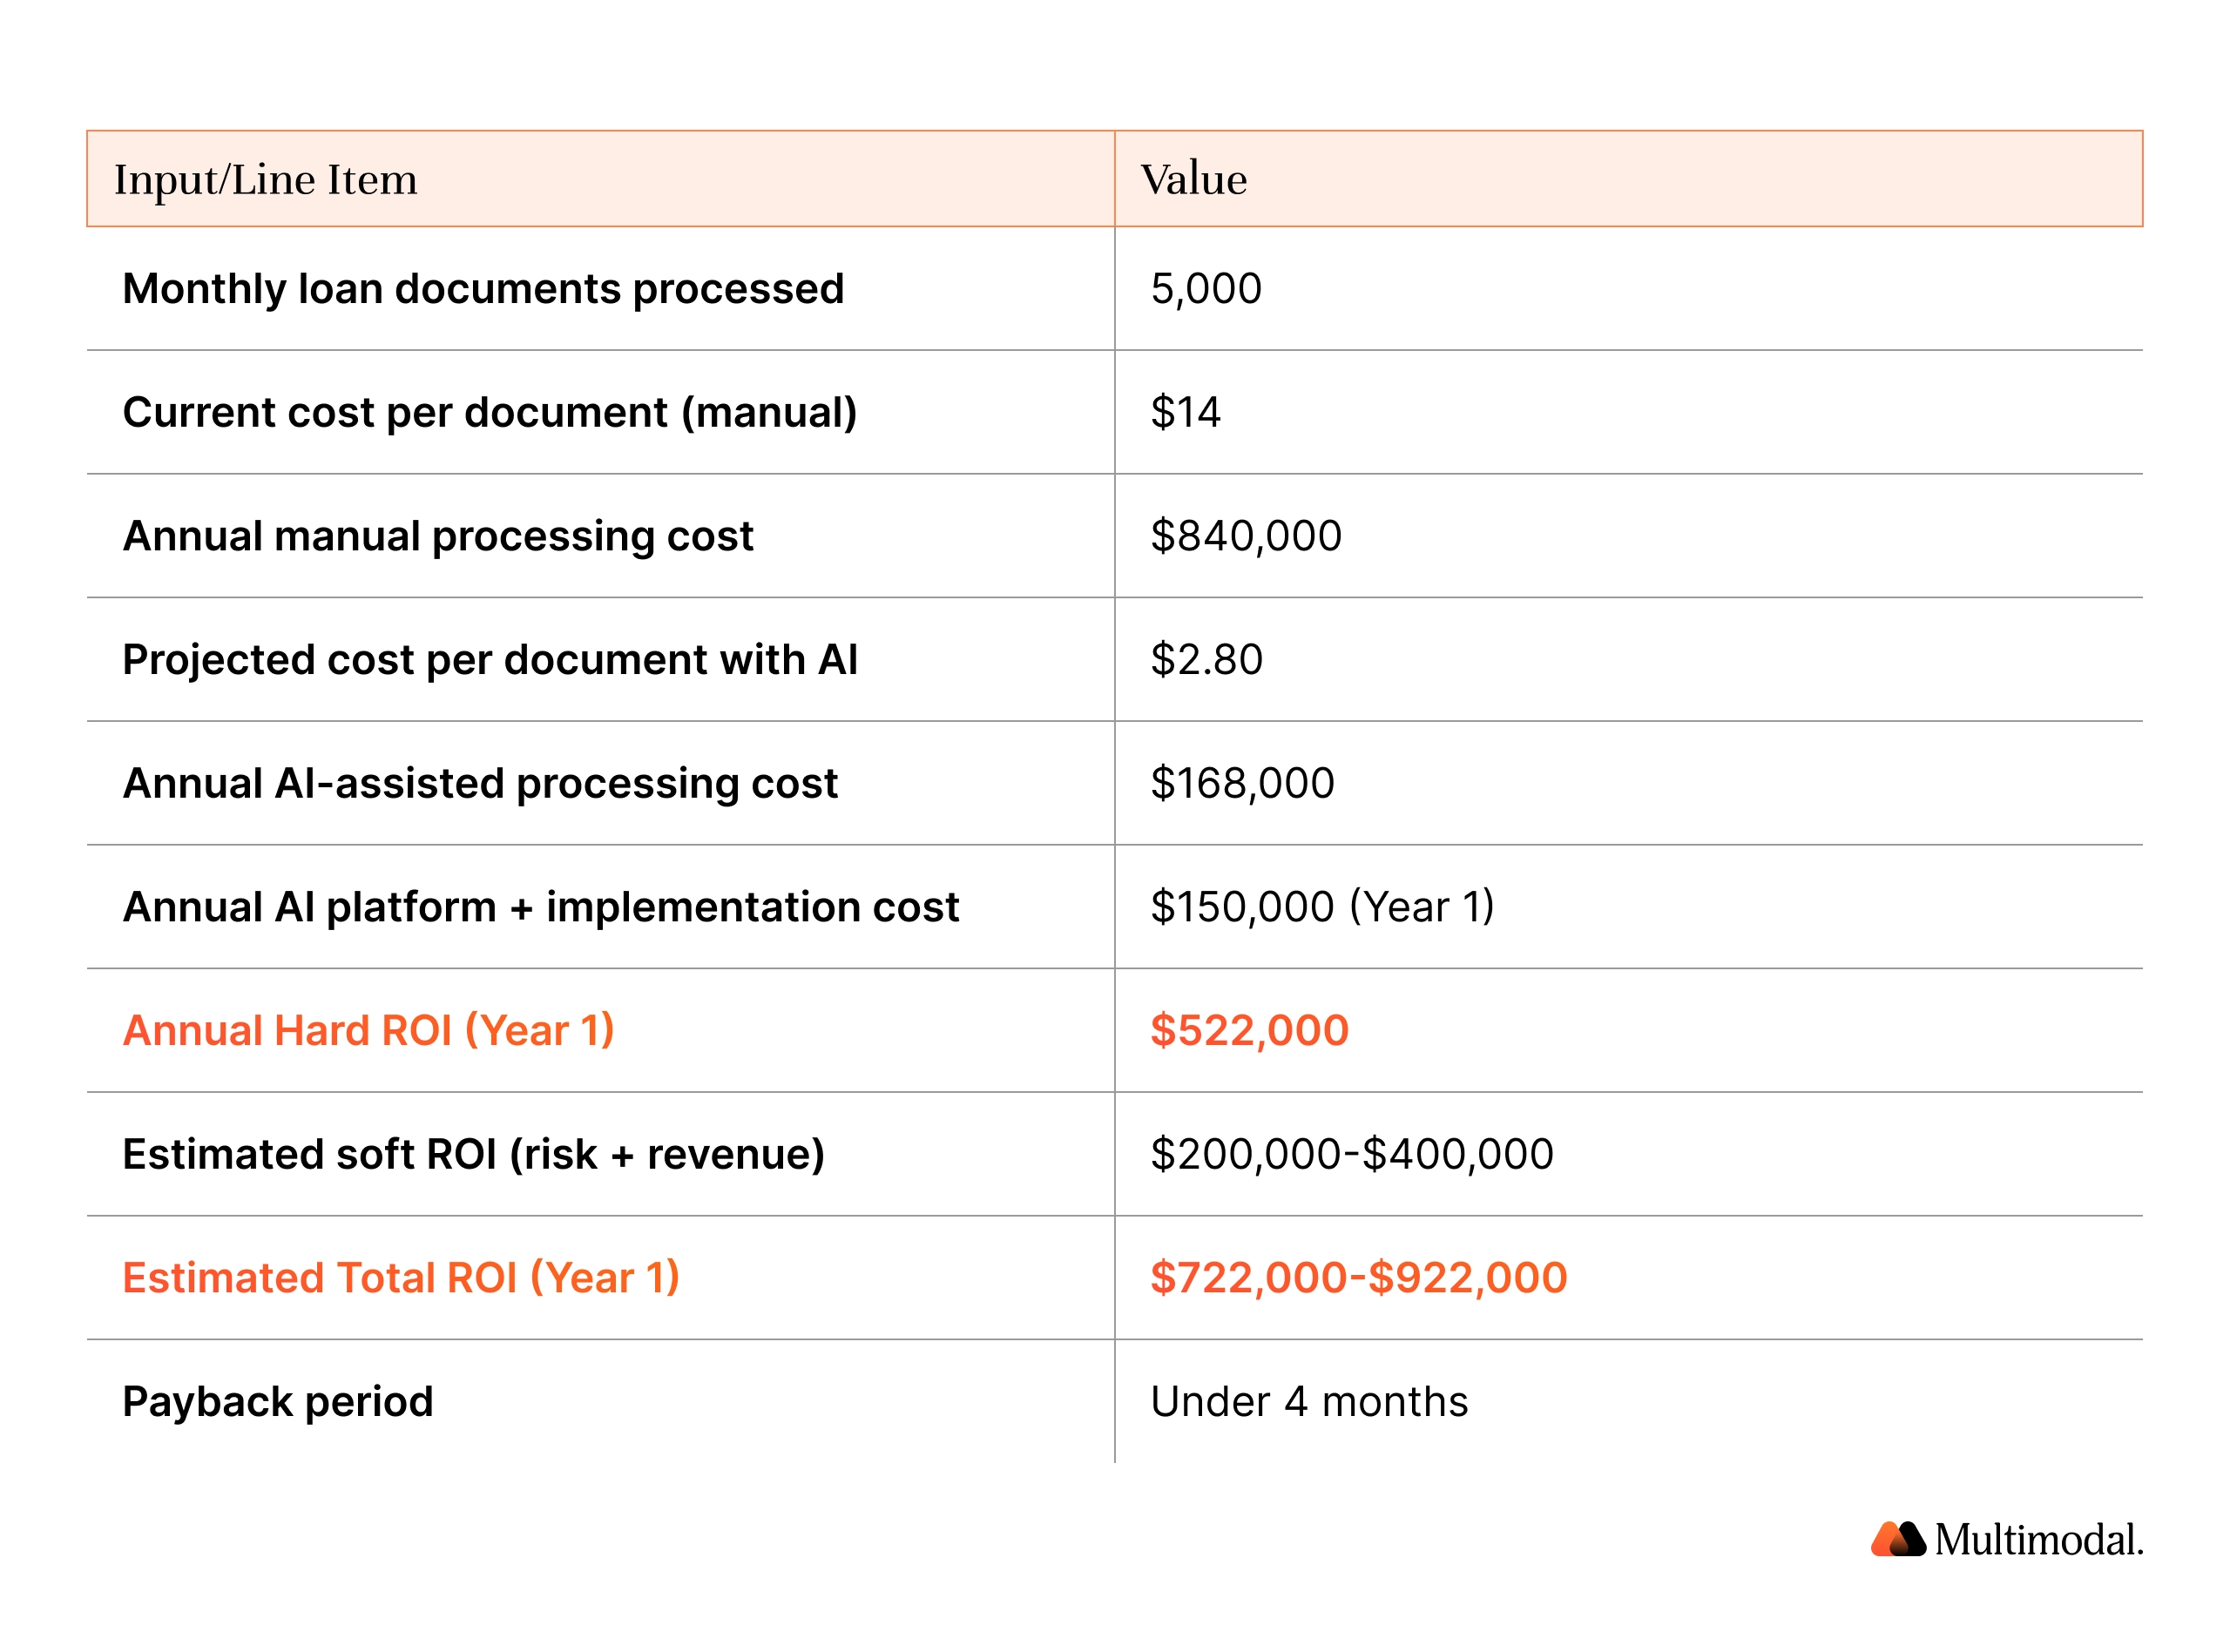
ROI Calculator Preview: Mid-Size Credit Union, 5,000 Loan Docs/Month
Adjust inputs to match your institution's key metrics. A comprehensive framework including both hard roi and soft roi reveals the real value that a cost-savings-only approach misses.
The Hidden Costs of NOT Automating
CFOs often model AI cost but not the cost of inaction. In an AI race where competitors deploy AI solutions at scale, standing still has financial consequences.
Lost loans due to slow processing. Manual processing that takes 5-7 days loses business to competitors closing in 24-48 hours. Every week of delay erodes revenue growth. Business leaders who frame AI as an expense miss the competitive dynamics reshaping lending and business models.
Examiner findings and compliance exposure. Manual compliance produces inconsistent documentation and audit trail gaps. AI-driven compliance review produces examiner-ready output. For institutions under scrutiny, this risk management value alone can justify AI cost and accelerate positive roi.
Staff burnout and turnover. Employees spending 70%+ of their time on repetitive tasks burn out and leave sooner. Replacing a trained loan processor exceeds $50,000. AI that eliminates repetitive tasks improves employee productivity, retention, and customer satisfaction.
Inability to scale. Manual processes only grow by adding headcount. AI-powered automation decouples volume from staffing, allowing 2-3x processing without proportional hiring. For credit unions competing against megabanks, this operational efficiency is a measurable competitive advantage. Institutions that implement AI for core workflows build infrastructure for growth, not just optimizing existing business processes.
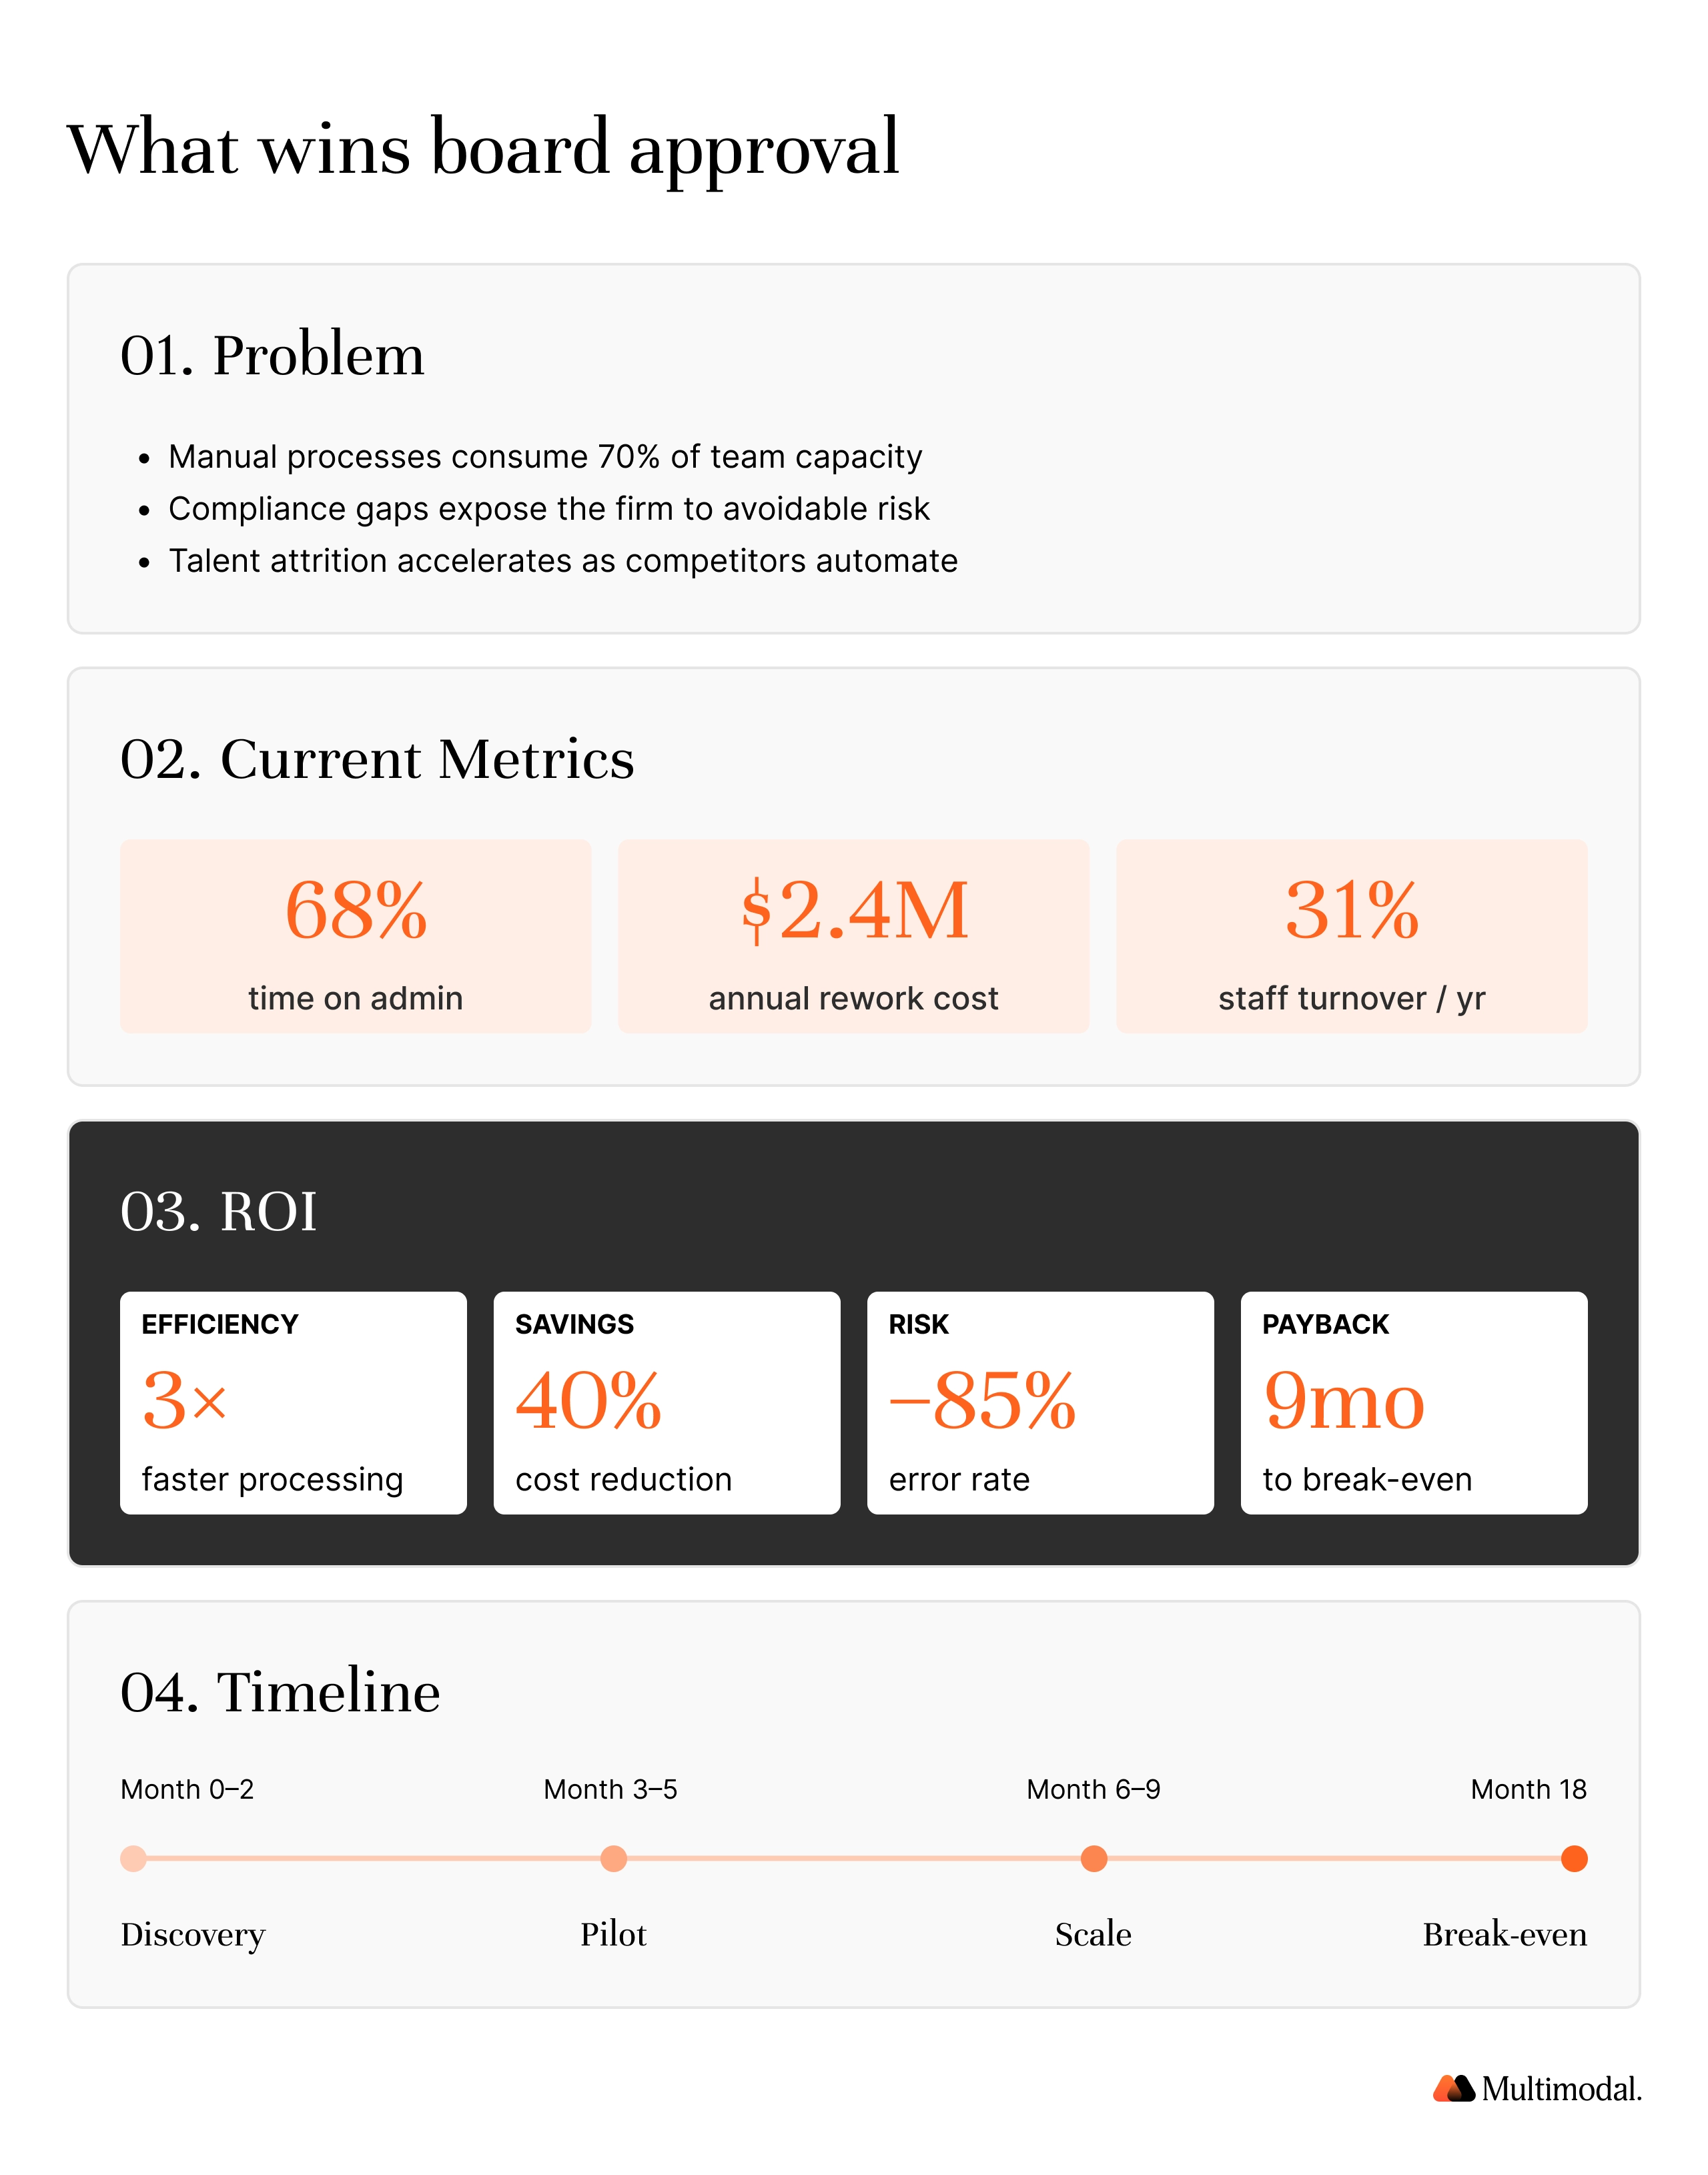
Making the Business Case: What to Present to the Board
Present AI projects as business outcomes tied to business objectives. The 1-page template that wins board approval:
Problem Statement: Lead with the operational bottleneck, not the technology. Frame around business outcomes: slow processing, losing loans, manual compliance creating examiner risk, or costs unsustainable at growth targets.
Current State Data: 3-5 key metrics: processing volume, cost per unit, error rate, cycle time, compliance findings. Strong data quality here impacts projection credibility.
Projected Impact (Four Pillars): Show improvements across all four pillars with conservative, moderate, and aggressive scenarios. Marketing teams can use revenue data for AI-driven marketing projections. This is where measuring roi comprehensively makes the difference.
Investment and Timeline: Total AI cost, including platform, integration, change management, and training. Map against 90-day, 6-month, and 18-month milestones. AI planning should include phased AI deployment for early wins.
Risk Mitigation: Address AI governance, data quality, AI deployment phasing, and regulatory readiness. Frame AI governance as a feature of the AI solutions under evaluation. Include change management plans for teams adopting new AI systems and AI tools.
Frequently Asked Questions
What is the typical ROI timeline for AI in banking?
Most institutions see initial hard roi within 90 days. Revenue acceleration compounds over 6-12 months. Deloitte's 2025 survey shows satisfactory ROI within two to four years for comprehensive AI transformation, though high-impact AI projects like document processing show positive roi in under six months. Institutions with clear AI goals reach measurable ROI faster.
How much does AI document processing cost?
Platforms typically range from $100,000 to $300,000 annually, depending on volume and integration complexity. Against cost savings from accuracy improvements and risk reduction, most institutions achieve payback within 3-6 months.
Is AI ROI different for credit unions vs. banks?
The framework is the same, but pillar weights shift. Credit unions see higher value from customer satisfaction and staff retention (soft roi). Cornerstone Advisors found 59% of credit unions have deployed generative AI, ahead of banks at 49%. The AI race favors institutions embedding AI across full workflows rather than deploying isolated AI tools.
How do we measure soft ROI for AI initiatives?
Assign proxy values: cost of replacing a departing employee, revenue impact of a 1-point NPS improvement, hours freed from repetitive tasks. Non-financial benefits compound over time, which is why AI investments should be evaluated on a multi-year horizon. Even conservative proxies add 30-50% to total business value beyond hard roi calculations.
What key metrics should we track after AI deployment?
Track across all four pillars: per-unit cost and volume (hard roi), loan cycle time and close rates (revenue), examiner findings (risk), and employee satisfaction, turnover, and customer satisfaction scores (strategic). The institutions achieving measurable roi from AI adoption track business outcomes, not just technology utilization.
See the Full AI ROI Picture for Your Institution
Use our AI ROI Calculator for Financial Services to run your own numbers with the four-pillar framework, or book a demo to see how agentic AI solutions like AgentFlow automate full lending, compliance, and operations workflows with minimal human intervention on routine tasks and full audit trails for examiner readiness.
See AgentFlow Live
Book a demo to see how AgentFlow streamlines real-world finance workflows in real time.

.svg)
.svg)
.avif)
.png)

.png)